Network Forensics: Sniffnet, Wireshark, and a SmartApeSG Infection
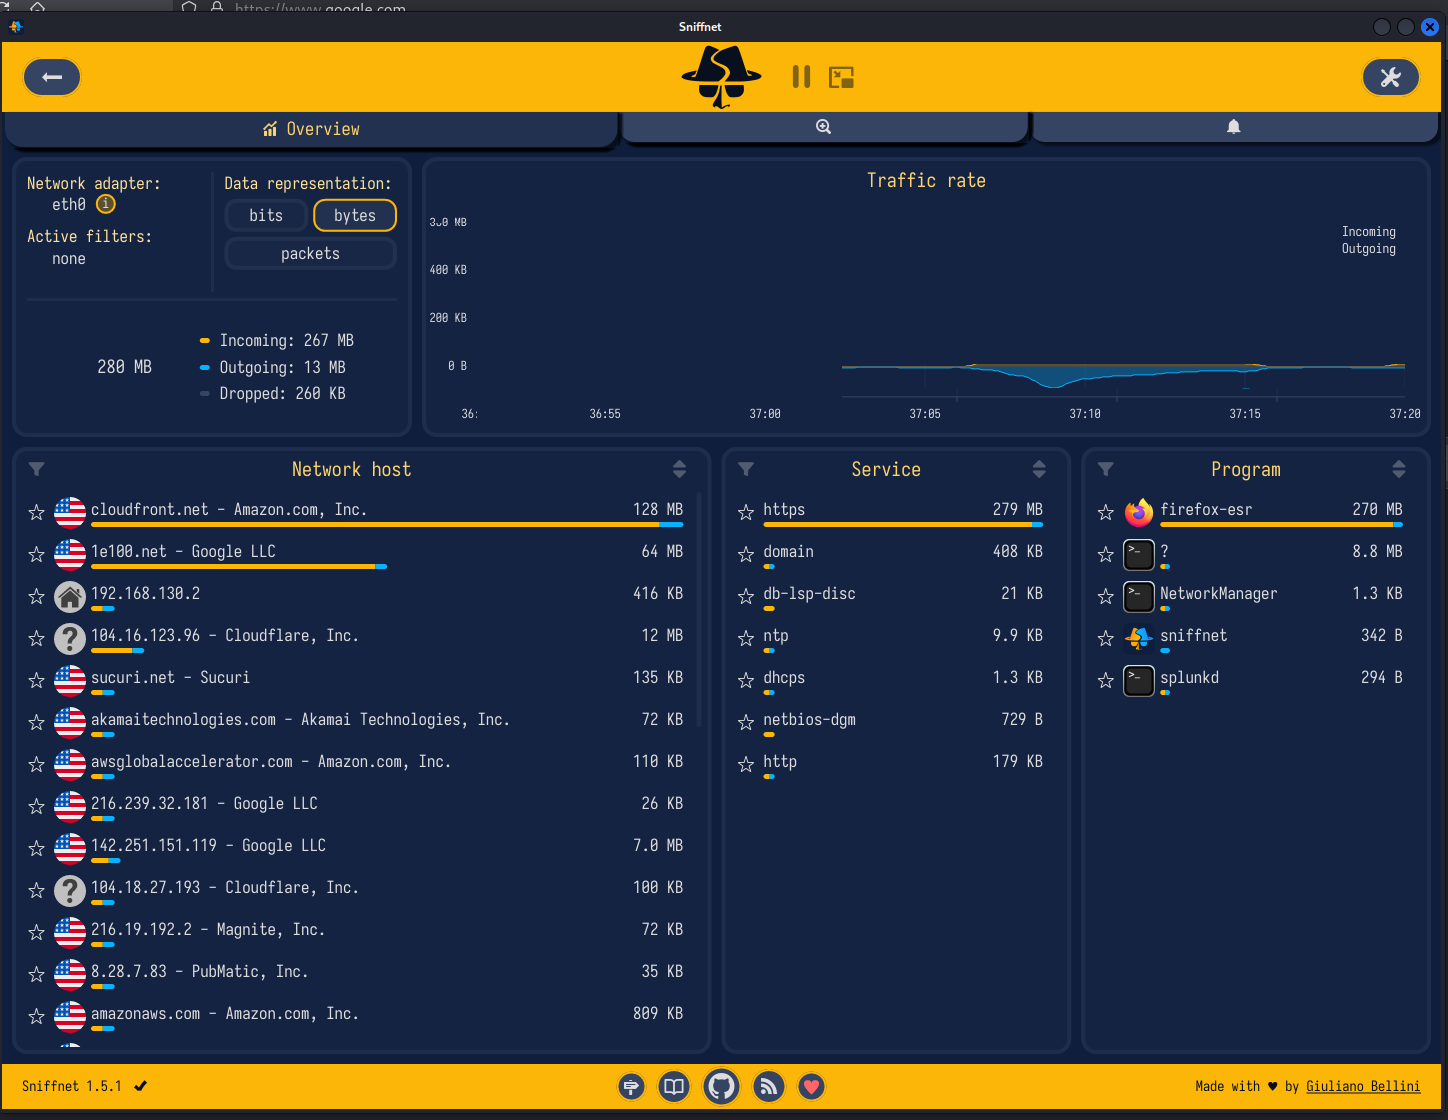
Welcome back!
Network packet monitoring is one of those fundamentals in cybersecurity you keep coming back to — like most fundamentals, it only really clicks once you’ve put in the screen time. Wireshark is the name everyone reaches for, but it wasn’t built with a quick glance in mind — sometimes you just want to know who your machine is talking to, not parse a hex dump. Sniffnet fills that gap: a tool aimed at making that kind of visibility approachable without dumbing it down.
In this article, we’ll cover what Sniffnet is, how to install it, and provide a practical comparison of its features alongside those of Wireshark.
What is Sniffnet?
Sniffnet is a free, open-source network monitor written in Rust, cross-platform across Linux, Windows, and macOS. It watches whatever traffic passes through your machine’s network interfaces and analyzes it live. What sets it apart from the traditional packet-analyzer approach — dumping raw frames onto the screen — is that it’s built around a visual-first dashboard: live charts, protocol breakdowns, and geographic context, rather than a scrolling wall of hex.
Step #1: Installation
For this walkthrough, I ran Sniffnet on Kali Linux, though the same install works on Windows and macOS too. Head to the official download page and grab the build for your OS — I went with the DEB package. Installing it is a single command:
sudo dpkg -i /home/kali/Downloads/Sniffnet_LinuxDEB_amd64.deb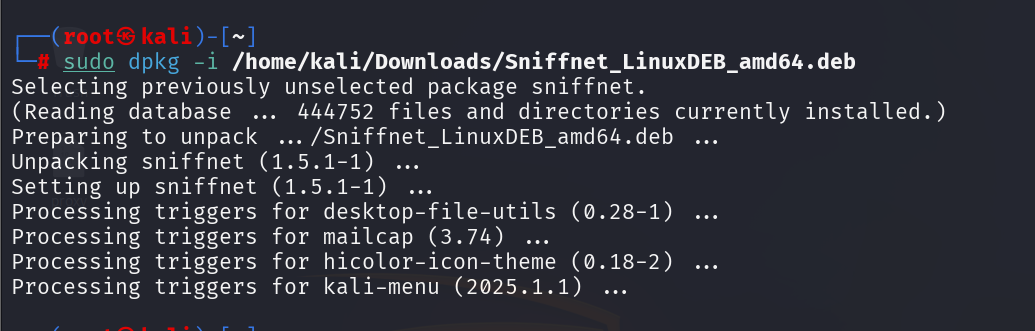
And that’s the whole install — you’re ready to start capturing traffic.
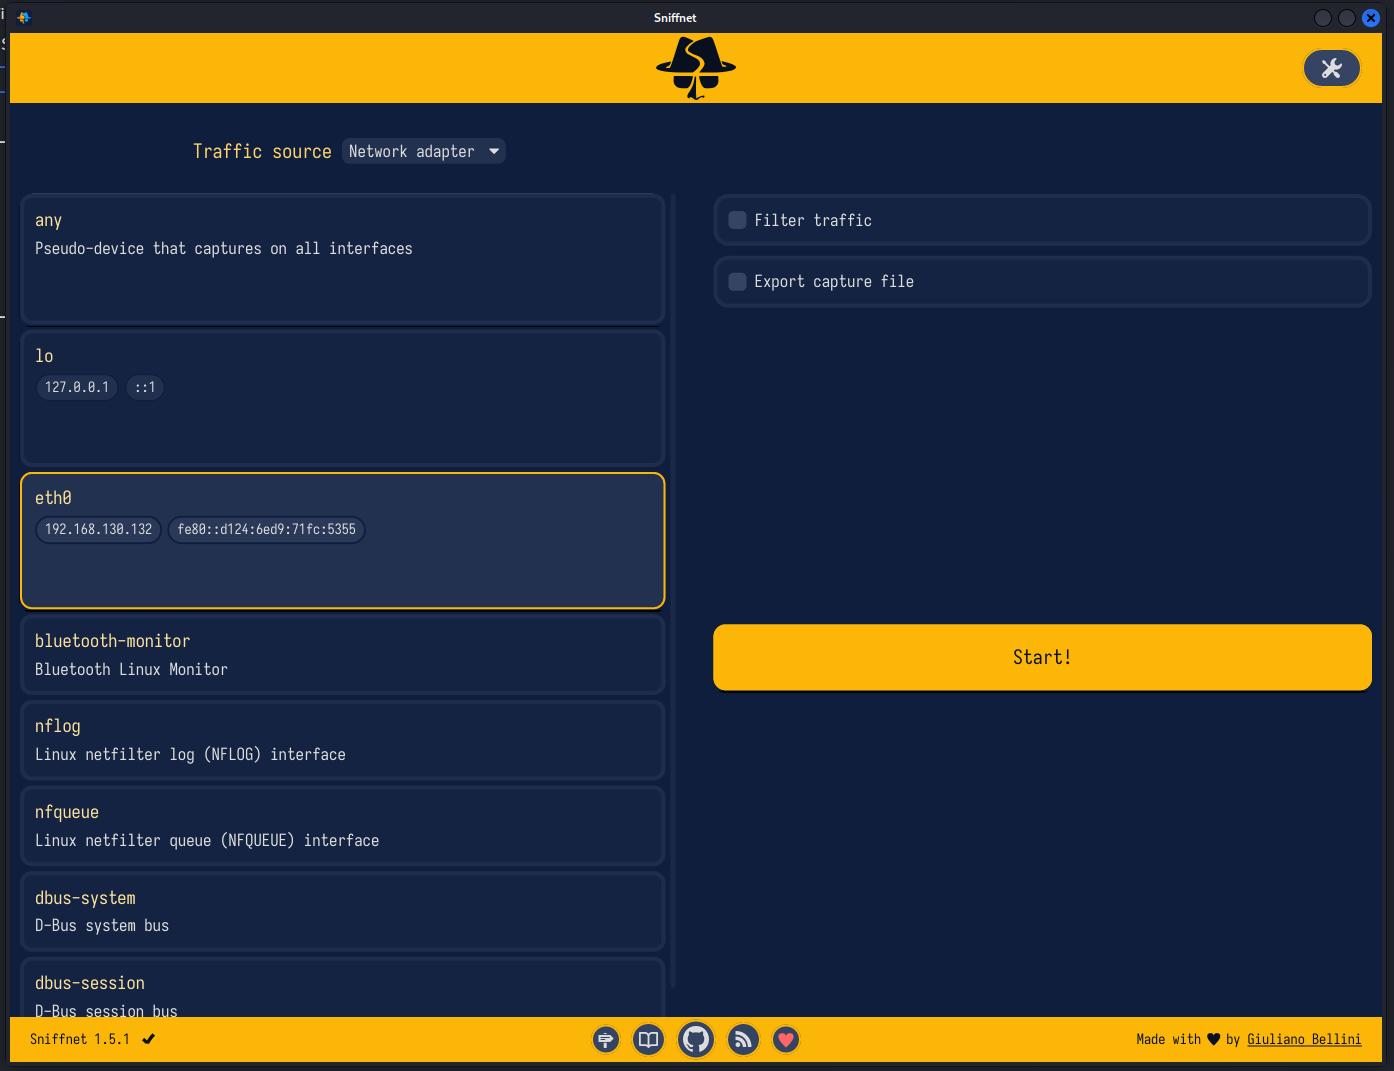
After starting the app, we need to choose the network adapter and click Start. If your system makes any network connections, you’ll see it as shown below.
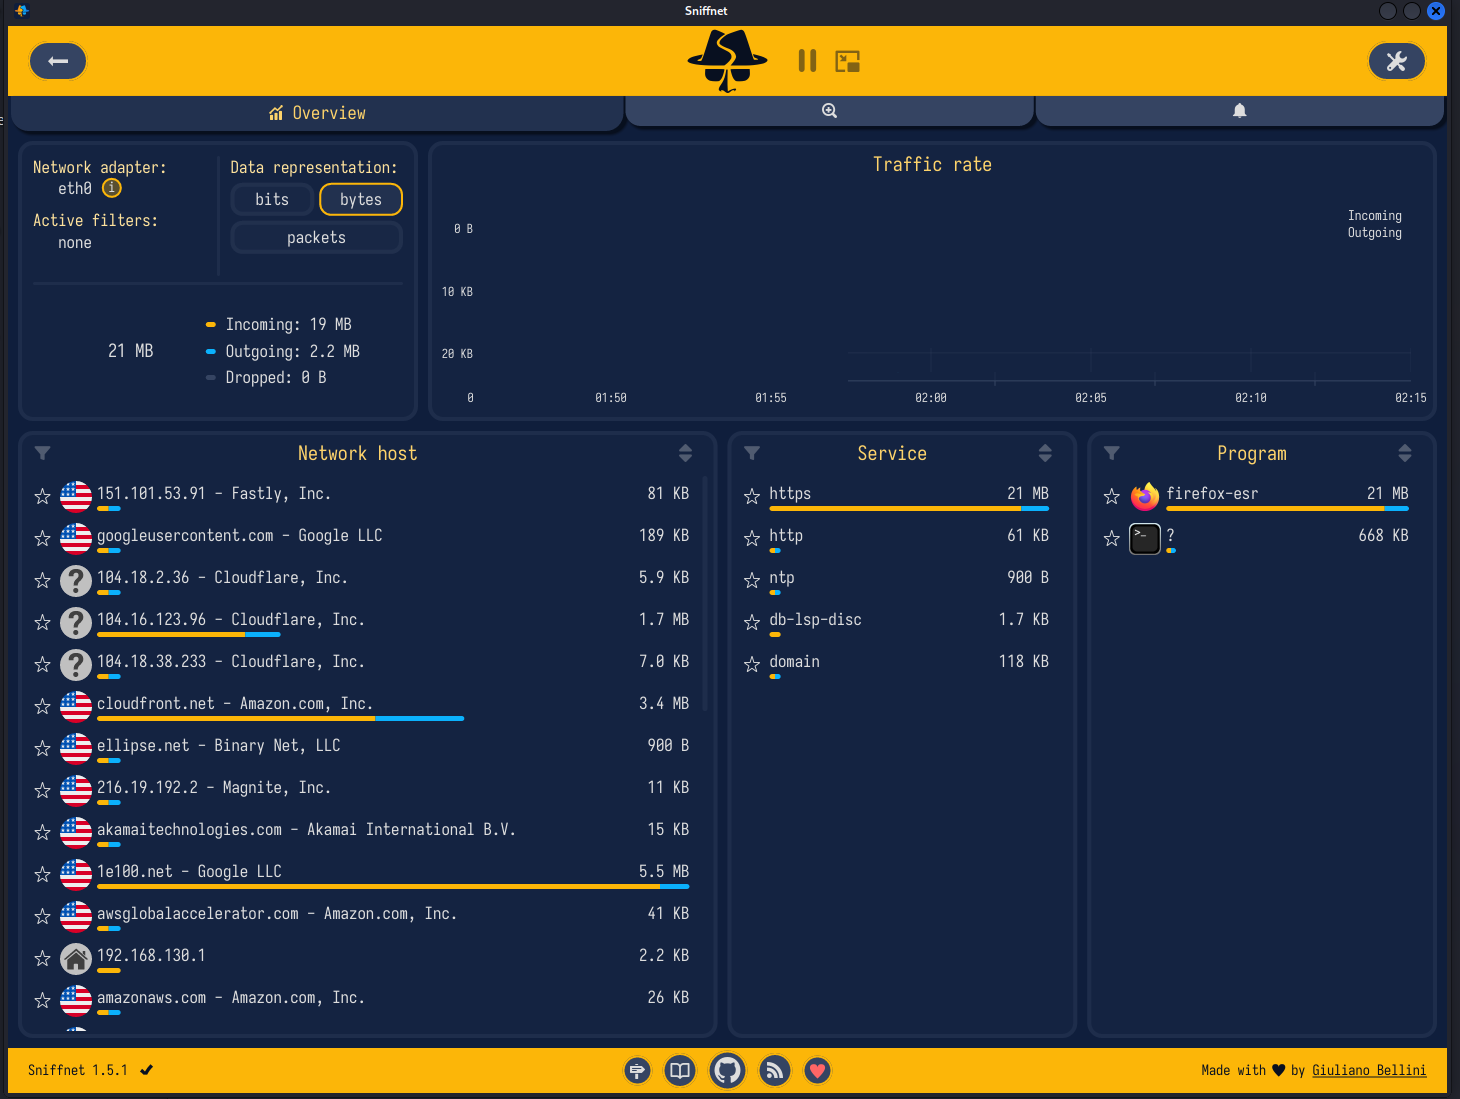
The layout itself is easy to read at a glance — the dashboard’s split into a handful of panels. Up in the top right sits the live traffic-rate chart, and next to it a donut chart totals up the session so far: incoming, outgoing, and anything dropped.
Where Sniffnet earns its keep is going past the basics. Any tool can hand you an IP and a port; Sniffnet actually recognizes over 6,000 upper-layer services, protocols, and known malicious signatures riding on top of that traffic. So instead of squinting at port 443 and assuming, it just tells you outright — HTTPS, in this case.
It also geolocates every remote host automatically, so you get an instant read on whether your traffic is staying close to home or routing halfway around the world to somewhere you don’t recognize. Layered on top of that, it resolves the ASN and domain for each host too — the ASN specifically tells you which organization actually owns that slice of the internet. In the screenshot above, most of what I captured traced back to Cloudflare’s US infrastructure — unremarkable on its own, but exactly the kind of context that makes triage faster.
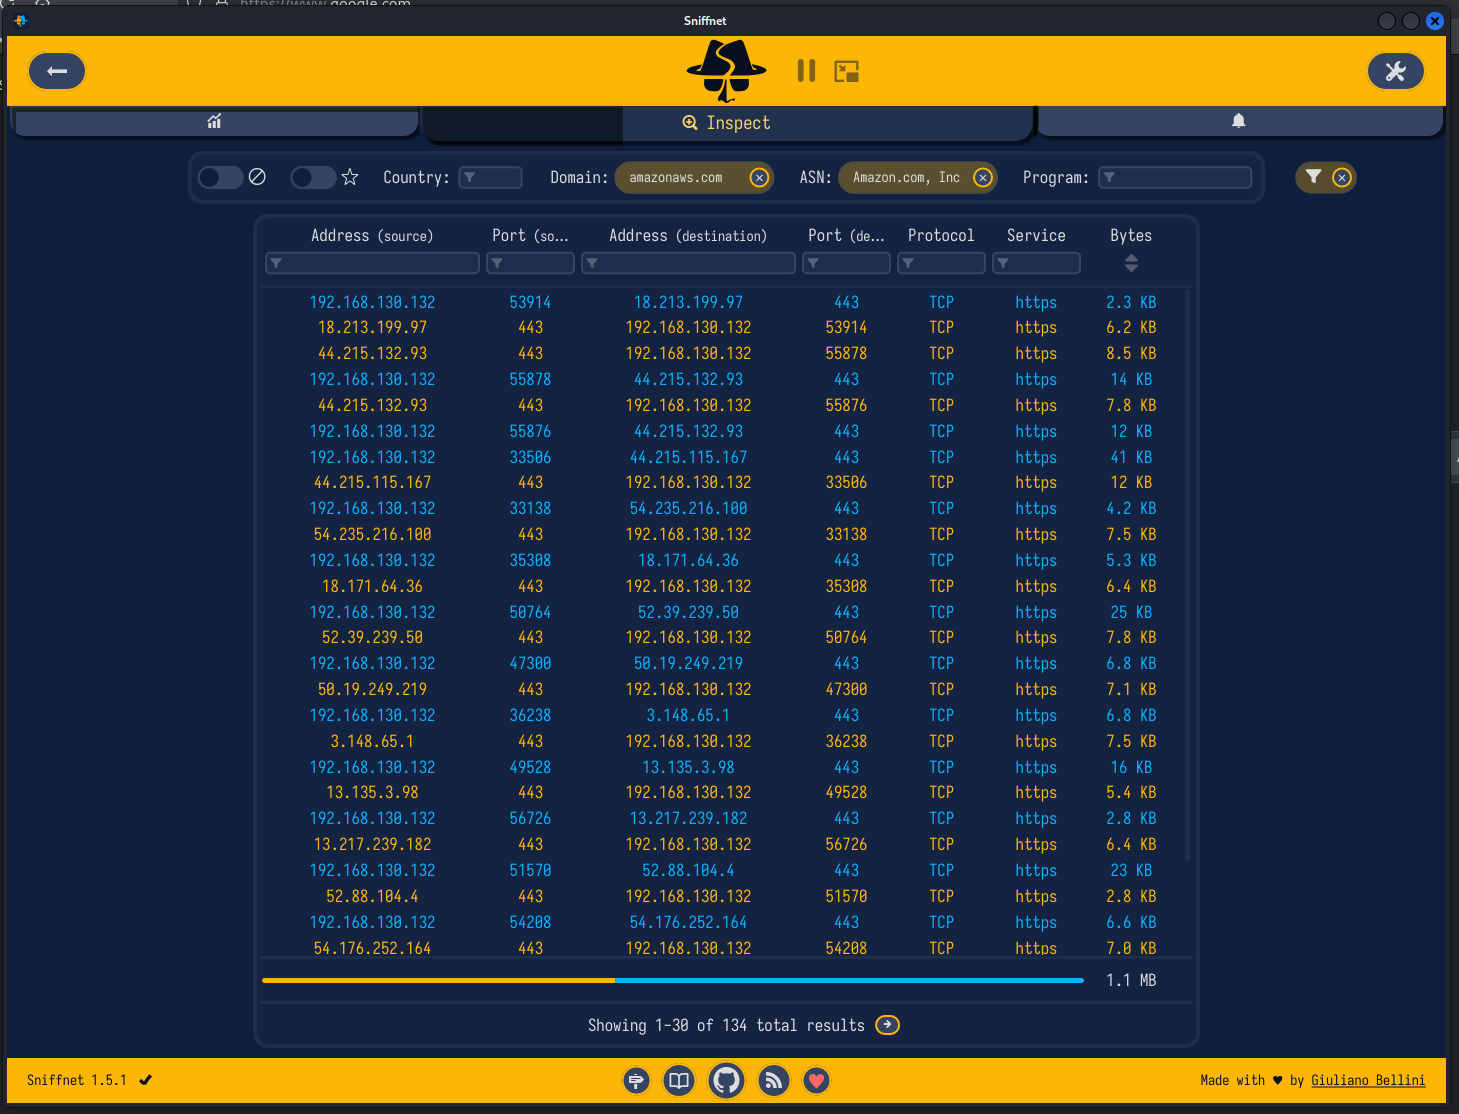
The main page provides a solid overview of network traffic. But when you find something worth digging into — say, an interesting host — you can click on it and see the full communication history.
Practical Comparison: Sniffnet vs. Wireshark
Step 1: Getting an Overview of the Capture
For this comparison, I used a single PCAP — a SmartApeSG infection sample containing traffic from two different RATs. I loaded the same file into both tools and worked through each step side by side.
Loading a pcap into Sniffnet gets you the same overview instantly — total traffic, the incoming/outgoing split, the donut breakdown — no extra clicks required. Wireshark can surface the same numbers, but you have to go find them: open Statistics > Capture File Properties, or Statistics > Protocol Hierarchy, and read them off a table instead of seeing them rendered.
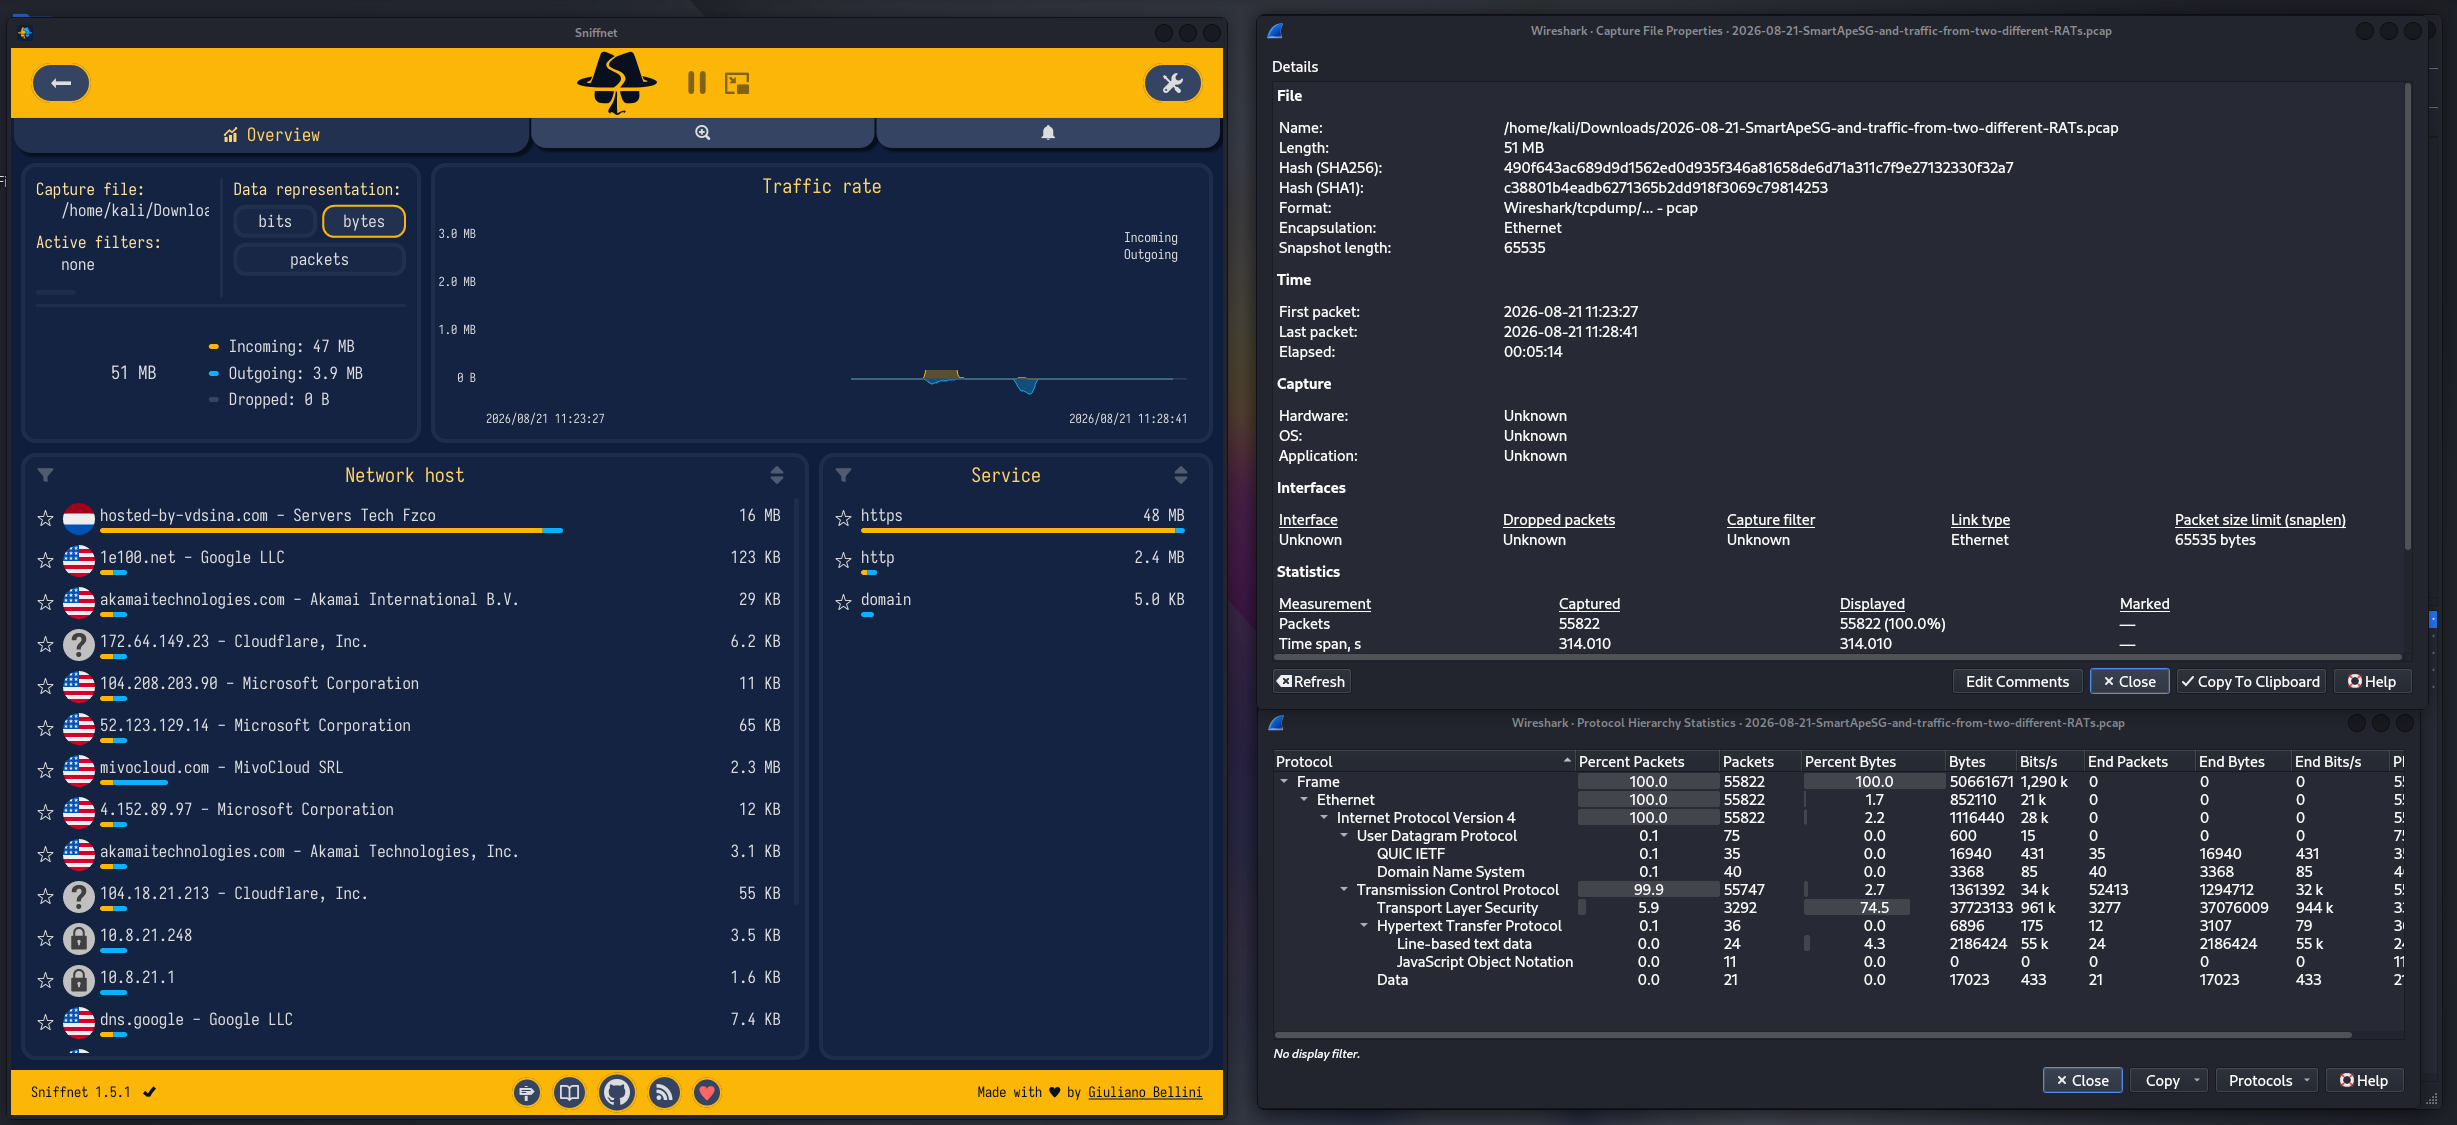
Both tools can answer “what’s in this capture,” but one shows it, the other tells it.
Step 2: Finding the Suspicious Host
Let’s imagine that we want to view hosts by traffic volume.
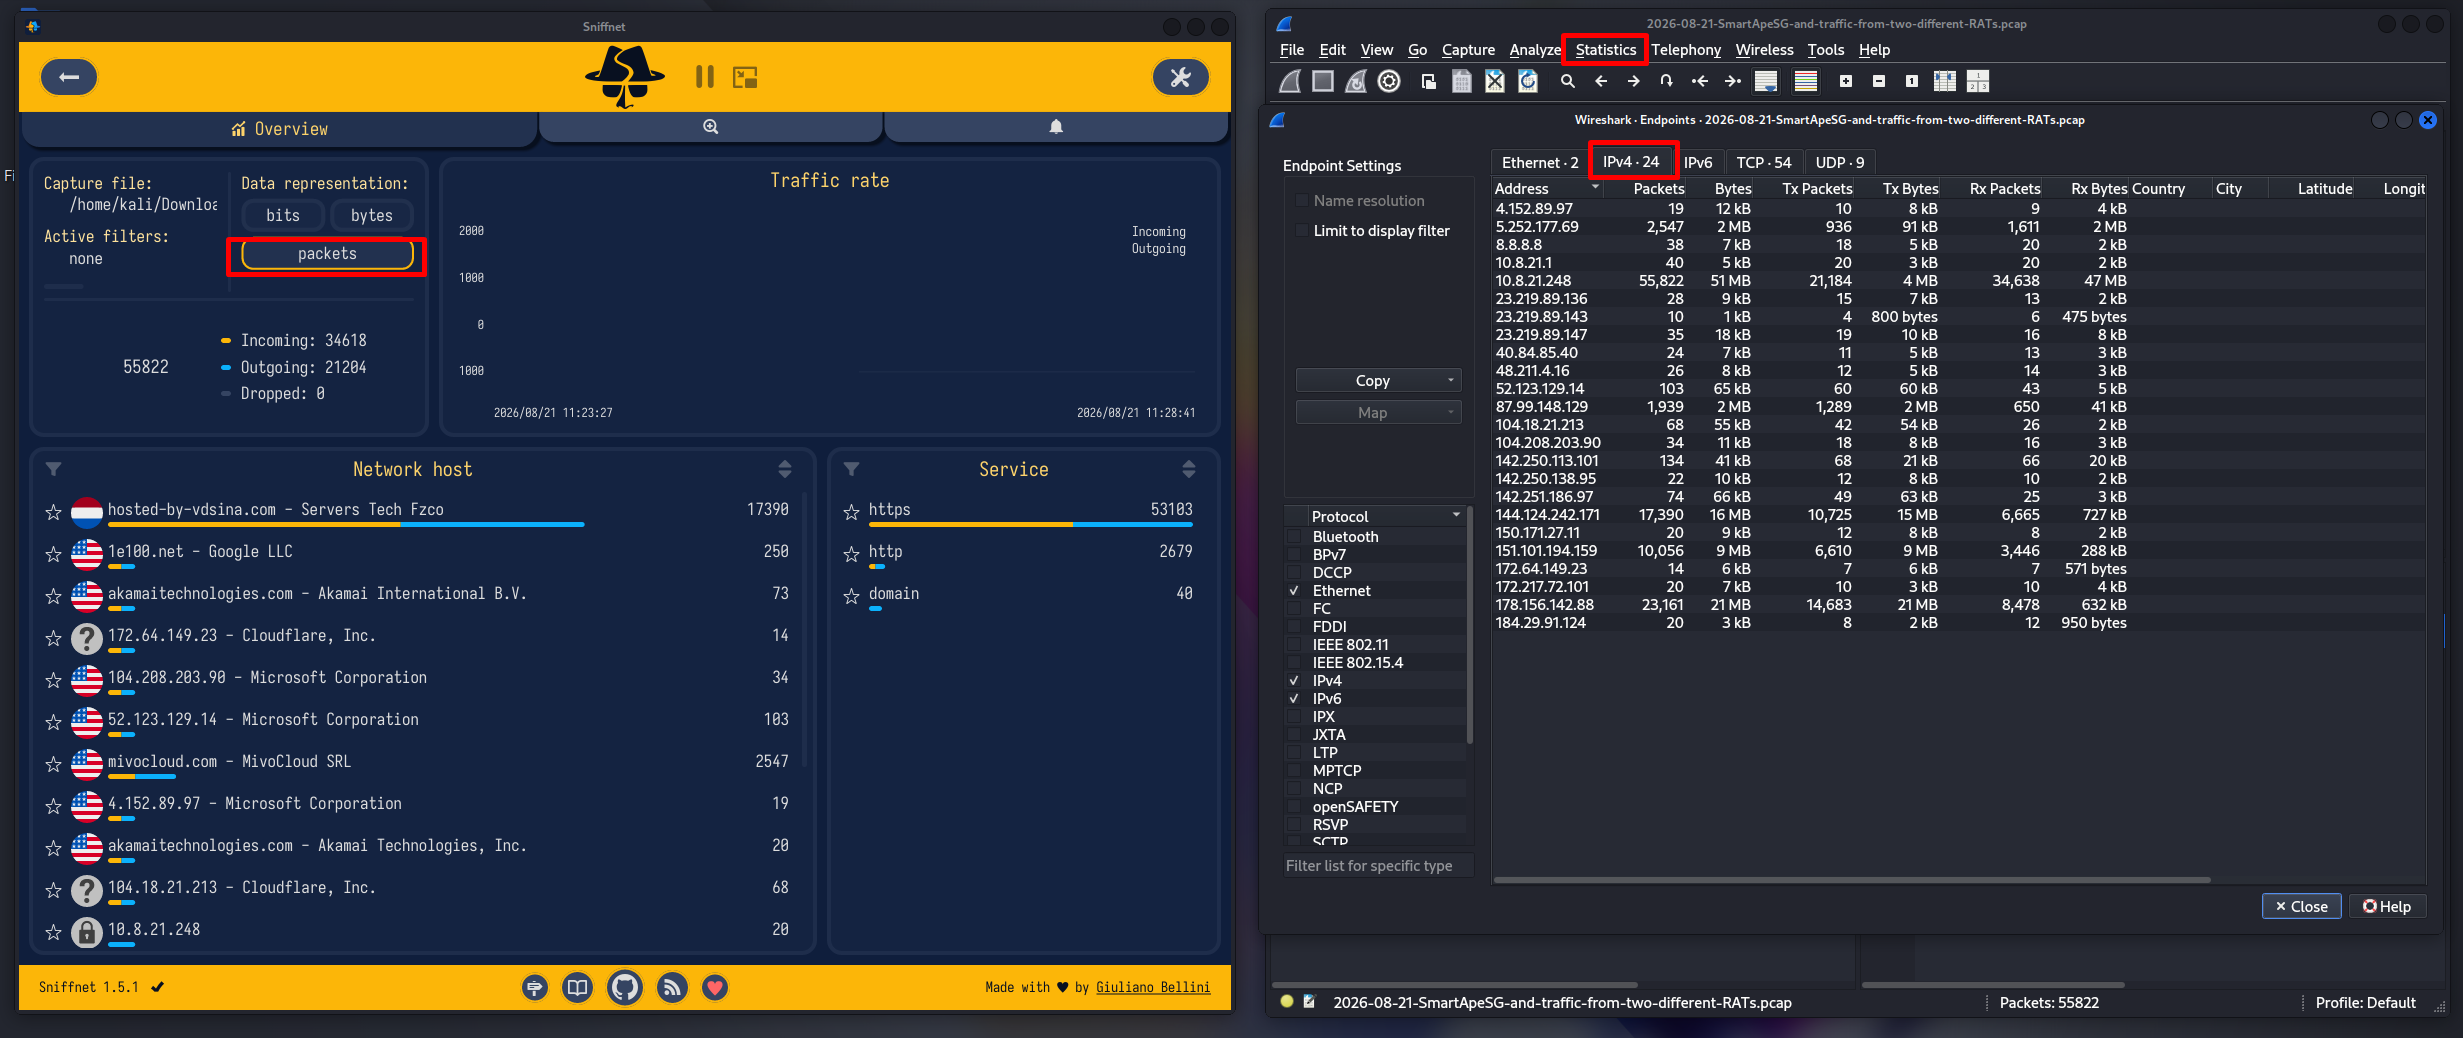
As you can see in the screenshot above, in Sniffnet we simply need to change the data representation to packets — and that’s it. In Wireshark, the equivalent requires navigating to Statistics > Endpoints > IPv4. One gap worth flagging: Wireshark doesn’t do geolocation or ASN lookups out of the box — you’d need to wire up your own GeoIP database, or step outside the tool entirely and check something like whois.
Step 3: Digging Into the Actual Conversation
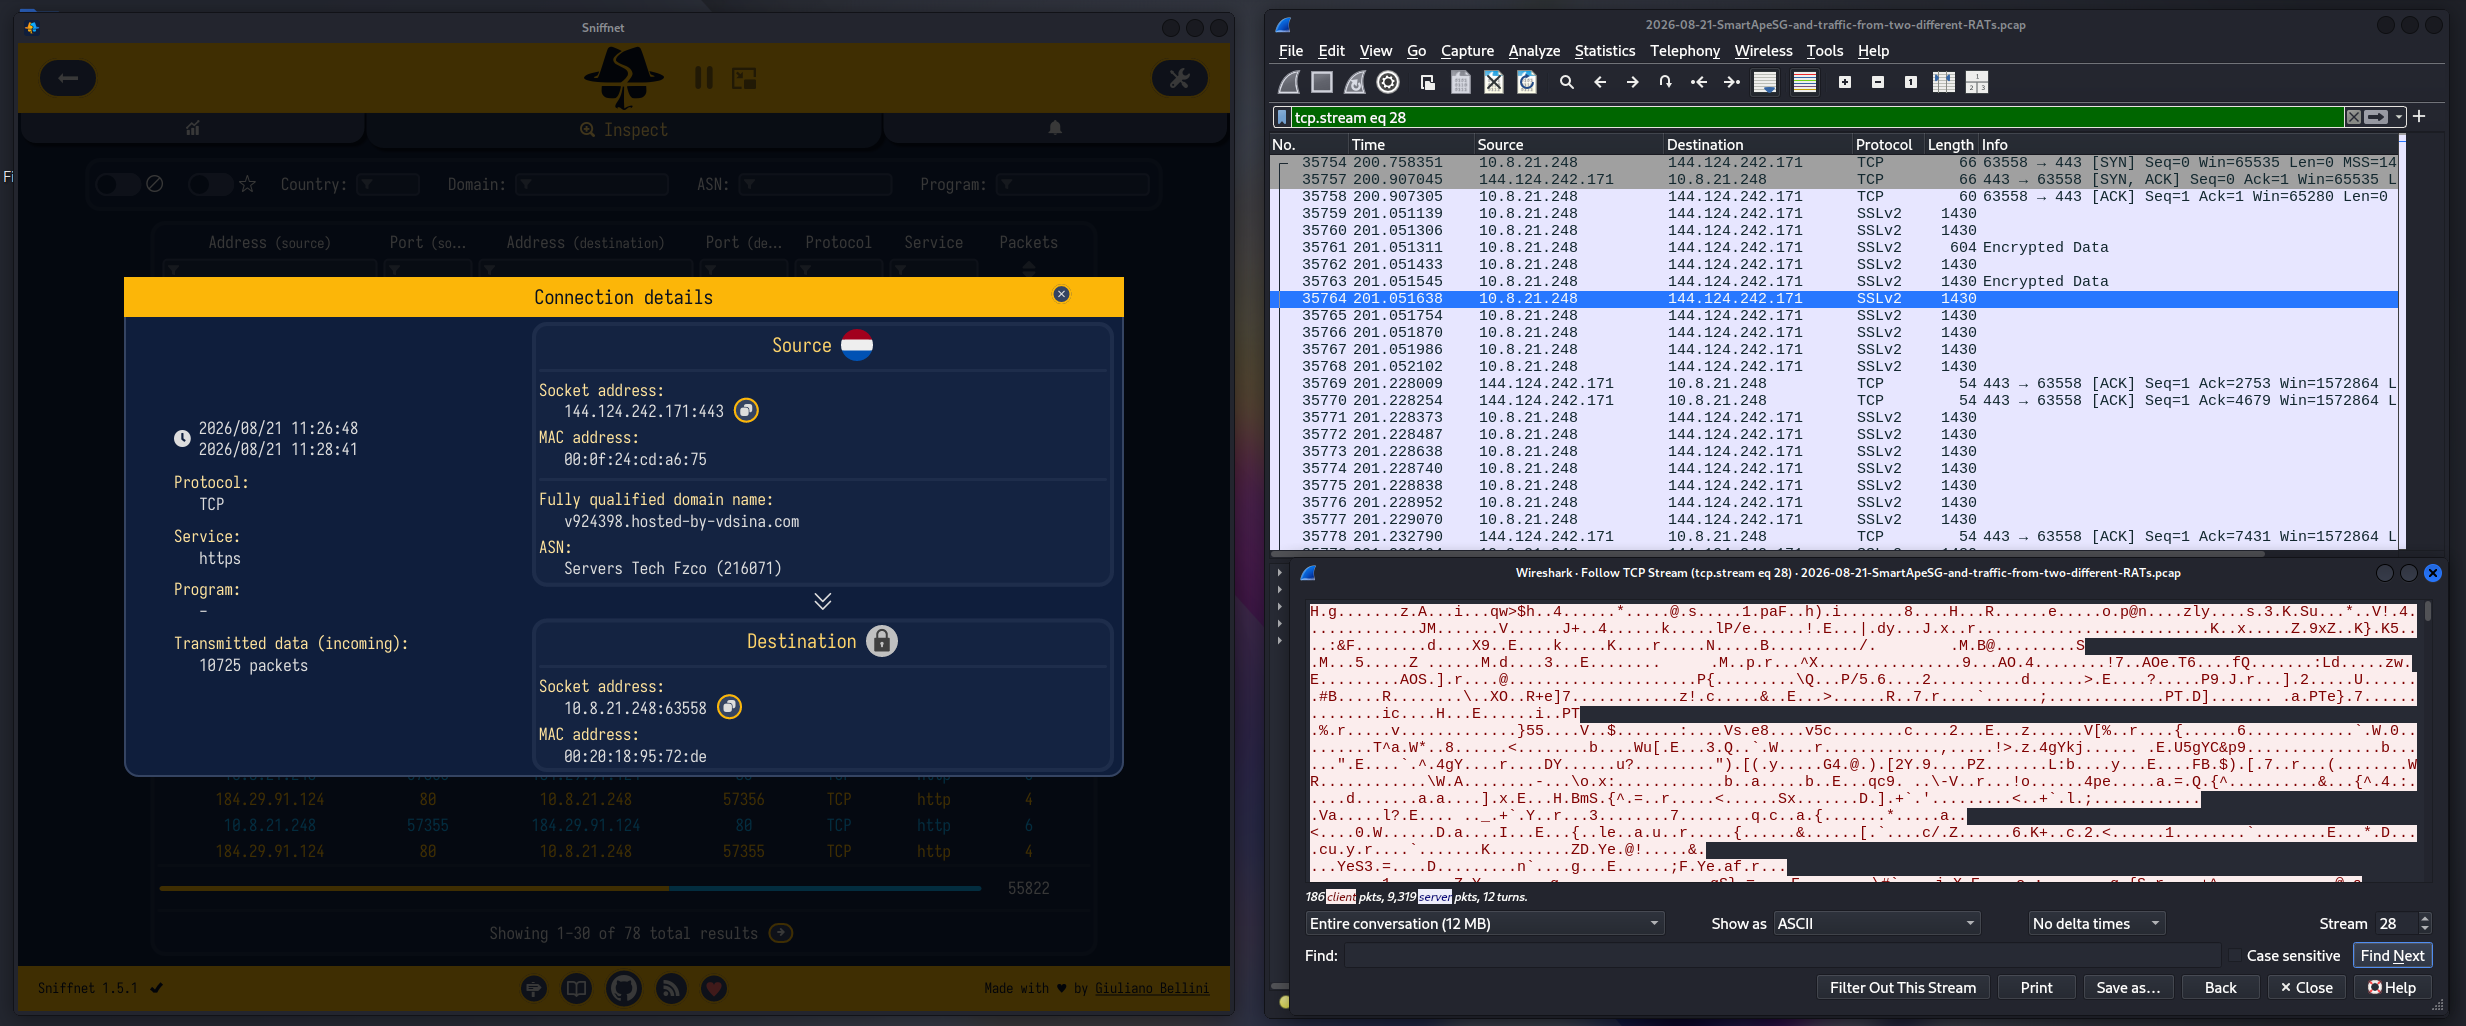
Wireshark clearly stands out here. By right-clicking a suspicious stream and selecting Follow TCP Stream, you can uncover the actual payload — which may include plaintext credentials, encoded commands, or unusual headers. In this capture, the post-infection traffic shows the RATs communicating with their C2 servers over encrypted TCP — the payload is unreadable, but the connection metadata is there. While we can see the traffic, Sniffnet has no capability to analyze it at this level. Sniffnet presents connection metadata, service labels, and host details — it isn’t designed for raw payload inspection. This is exactly why Wireshark remains essential even after Sniffnet handles the initial triage.
Step 4: Extracting Evidence
Since version 1.3, Sniffnet allows exporting captured network traffic as a PCAP file. You can configure this on the initial page of the app. By default, the option is disabled, but enabling it is as simple as checking the dedicated checkbox.
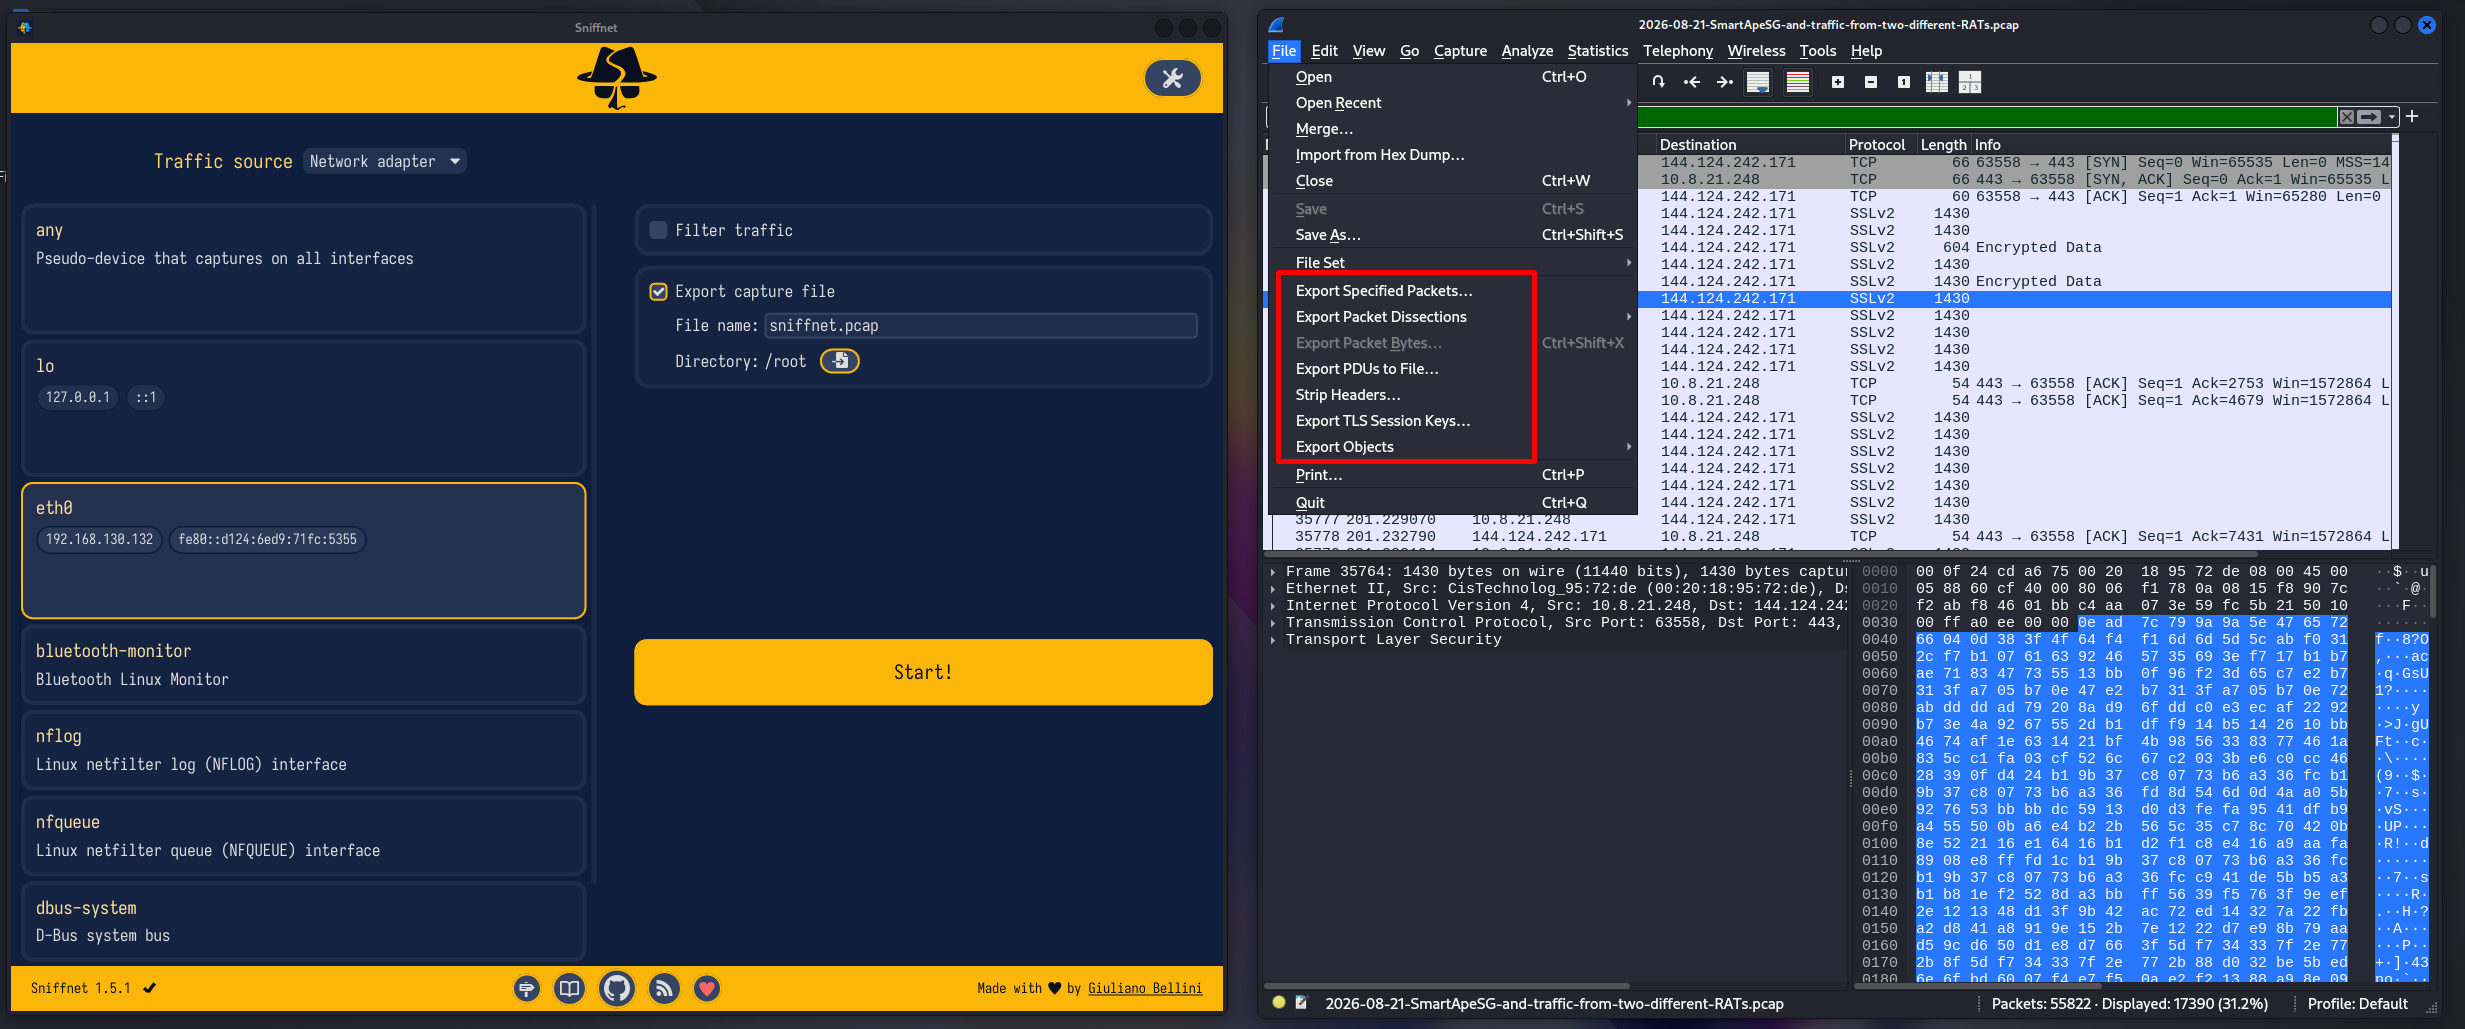
Wireshark, unsurprisingly, gives you a lot more to work with on the export side. Beyond just saving the full capture as a PCAP, you can export only the packets currently selected, dump packet dissections out as plain text, pull specific protocol objects like transferred HTTP files, or grab the raw bytes of an individual packet.
Step 5: Filtering Down to What Matters
Sniffnet handles filtering entirely through its UI — IP address, port, protocol, application-layer service, all clickable, no syntax required.
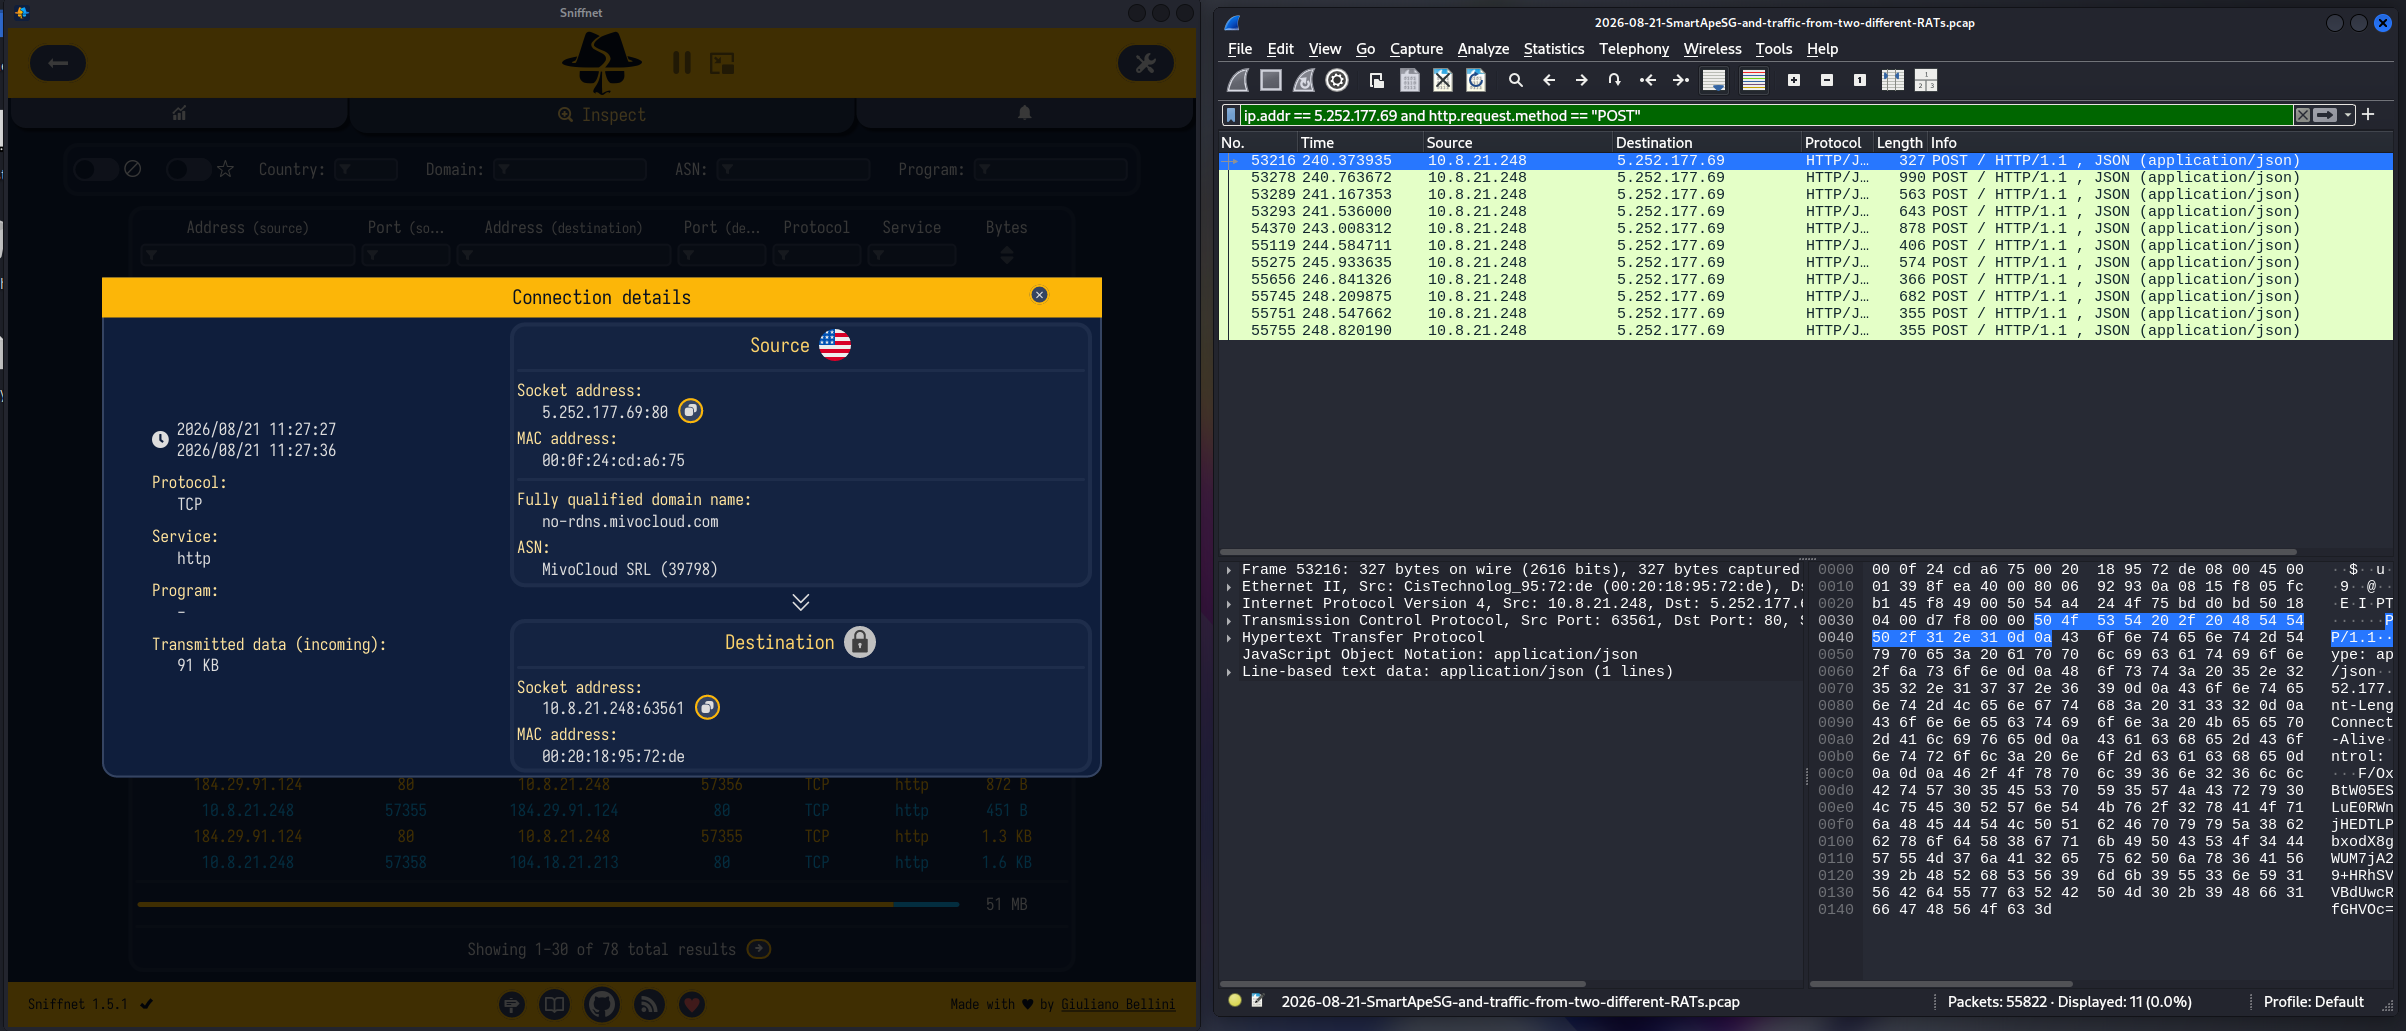
Wireshark’s display filter syntax is where it really pulls ahead. Filters like ip.addr == 5.252.177.69 combined with http.request.method == "POST" let you drill down to exactly what you need. You can chain logical operators, target specific fields deep within a protocol, match payload content by string, or isolate packets by flag. Sniffnet simply has no equivalent for that level of precision.
Summary
When comparing Sniffnet and Wireshark, it’s clear that each tool has its place. Sniffnet is great for monitoring network traffic and keeping tabs on your internet activity — it’s effective for gathering statistics and identifying who your machine is exchanging data with. But it falls short when it comes to more in-depth network investigations. Wireshark, on the other hand, covers a much broader range of capabilities for monitoring, filtering, and exporting traffic.
If you’re simply looking to check your traffic at a glance, Sniffnet will get the job done. But if you’re aiming to go deeper and sharpen your network analysis skills, Wireshark is the way to go.
Stay curious!